Configure and monitor Sketchatone in real-time with the web interface
Web Dashboard
The Sketchatone web dashboard provides a visual interface for configuring and monitoring your tablet in real-time. Changes made in the dashboard take effect immediately without restarting the application.
Accessing the Dashboard
macOS App
The macOS app automatically opens the dashboard in your browser when launched.
Default URL: http://localhost:8080
From Source (Development)
Start the server:
# Node.js
npm run server

# Python
python -m sketchatone.cli.server
Then open your browser to http://localhost:8080
Raspberry Pi / Zynthian
If you've enabled the web server in your config:
{
  "server": {
    "http_port": 8080,
    "ws_port": 8081
  }
}
Access from another device on your network: http://<pi-hostname>:8080
Note: For minimal resource usage, you can disable the dashboard by setting ports to null.
Dashboard Features
1. Live Tablet Monitoring
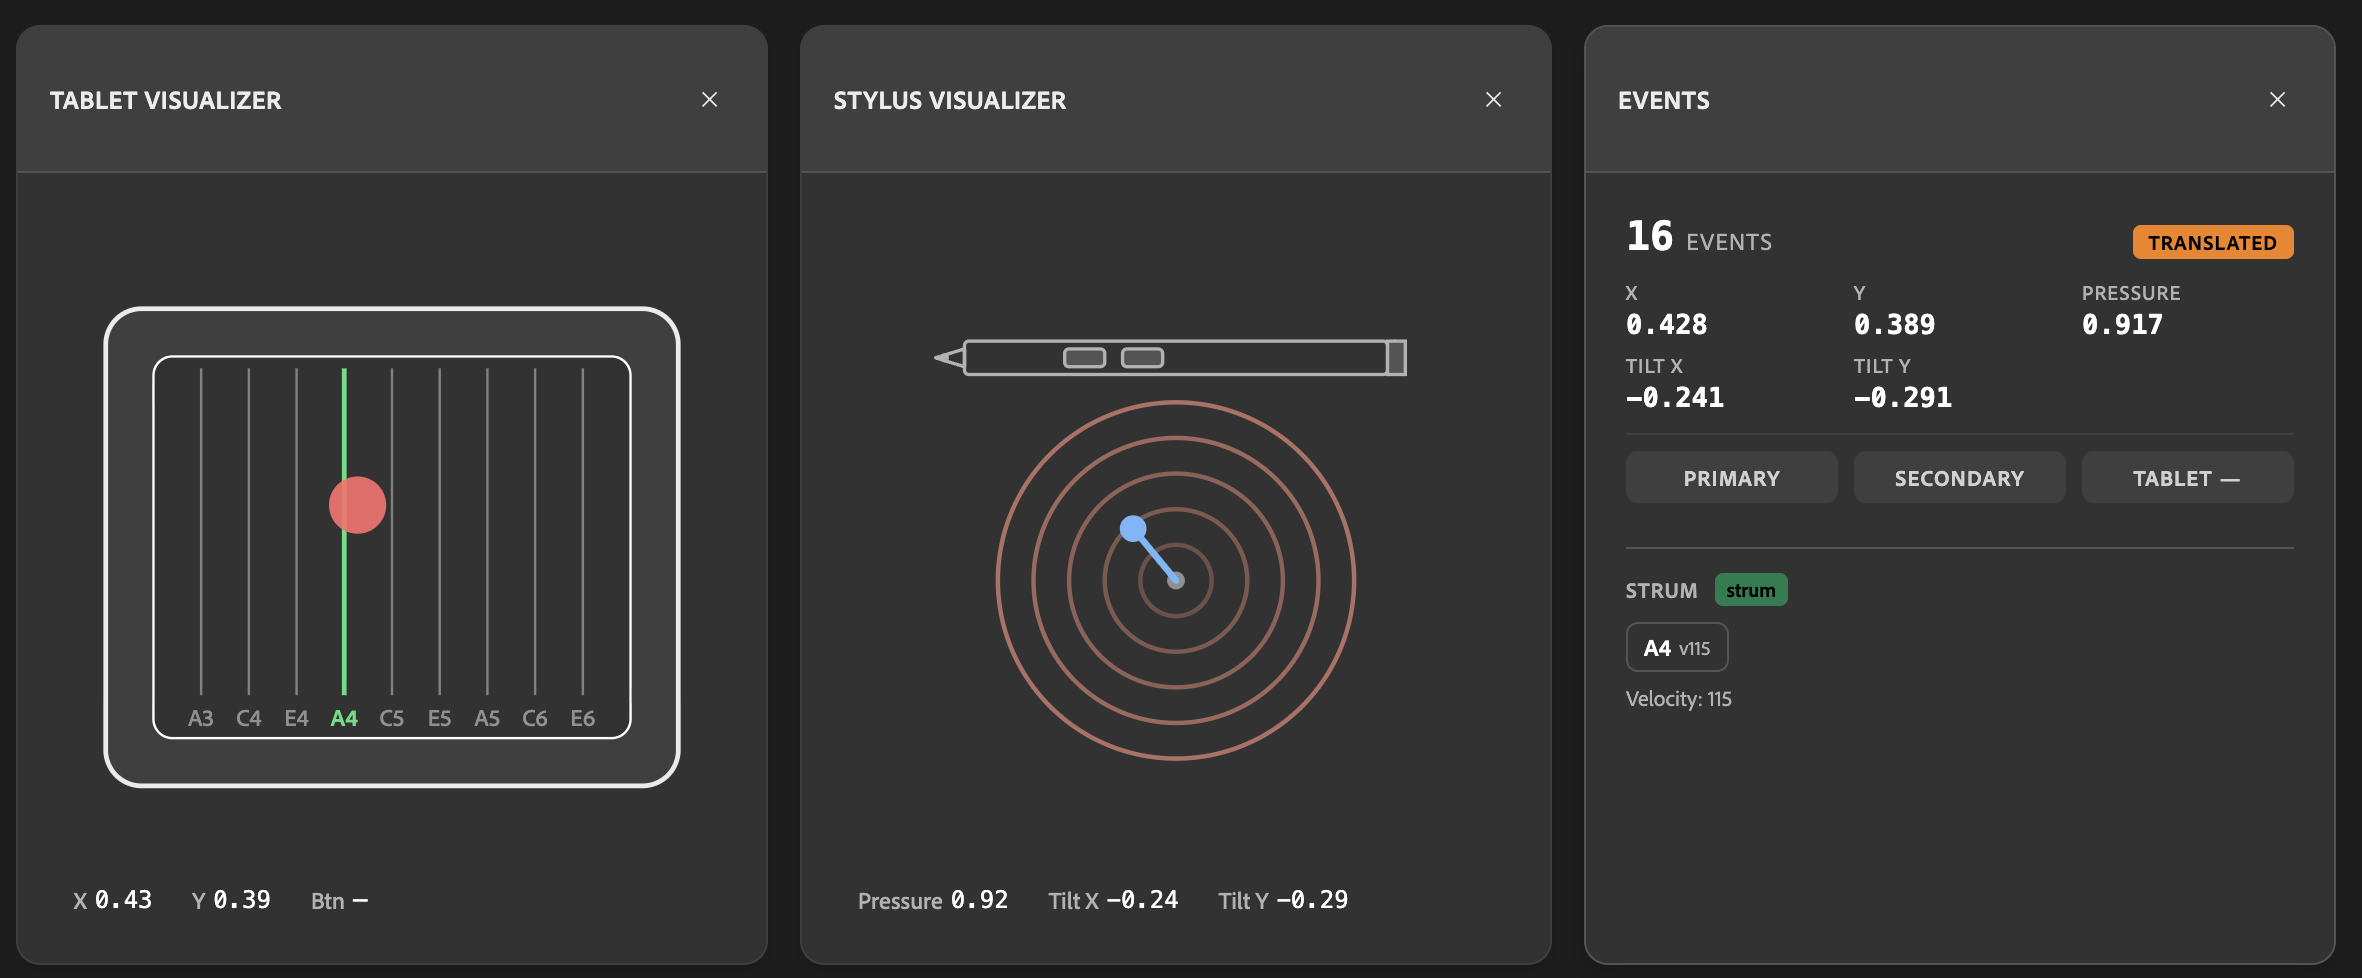
The dashboard displays real-time tablet input:
- Pen position (X/Y coordinates)
- Pressure level
- Tilt angles (X/Y)
- Button states
- Strum events
This helps you understand how your tablet movements translate to MIDI output.
2. Strumming Configuration
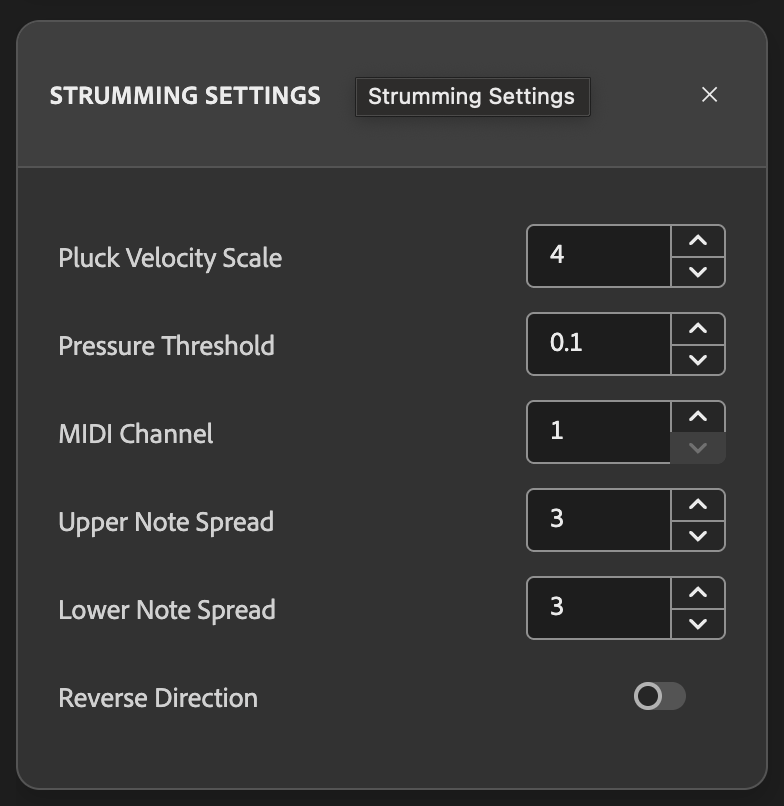
Configure core strumming settings:
- Chord Selection - Choose from preset chords or enter custom notation
- MIDI Channel - Set output channel (0-15 or omni)
- Pressure Threshold - Adjust sensitivity
- Note Spread - Control octave range
- Invert X - Flip for left-handed use
Changes apply immediately as you strum.
3. Parameter Mappings
Map tablet inputs to musical parameters:
Note Velocity
- Control source (pressure, tilt, position, etc.)
- Min/max range
- Response curve
- Spread type
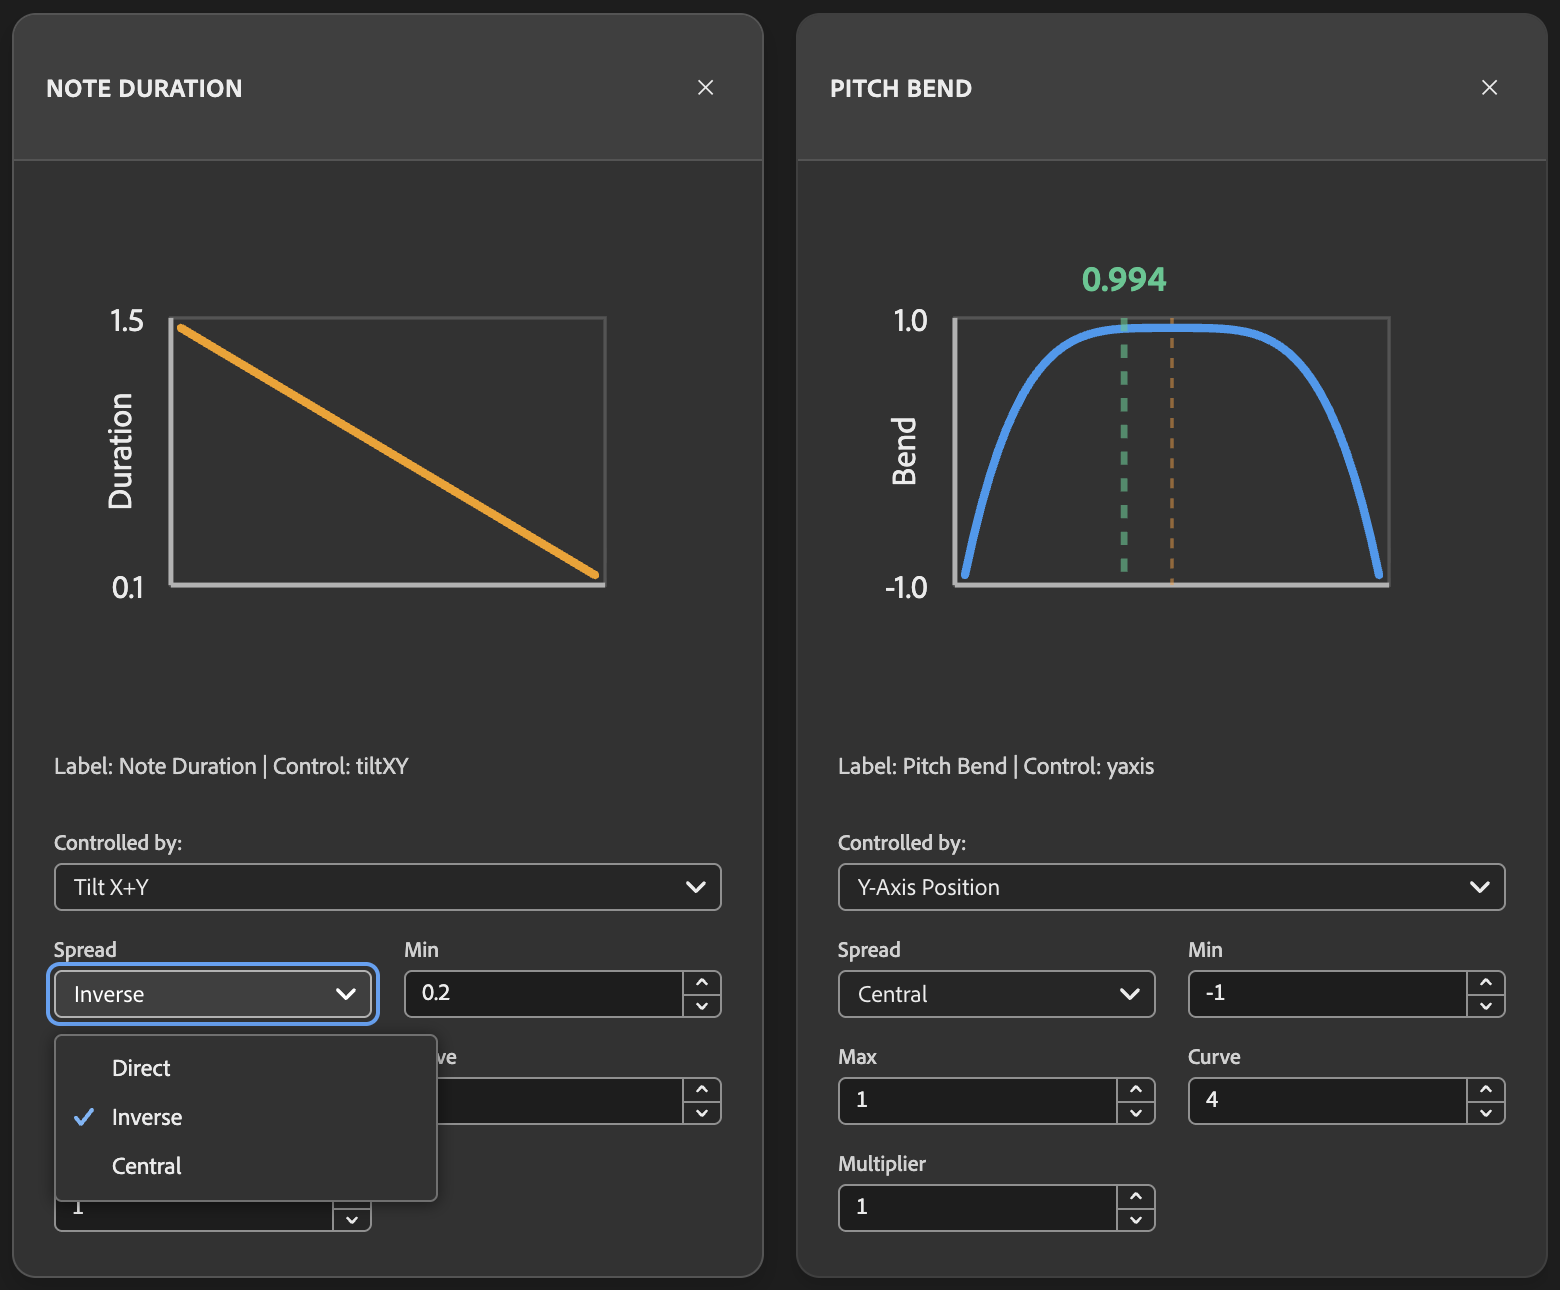
Note Duration
- Control source
- Duration range (seconds)
- Response curve
Pitch Bend
- Control source
- Bend range
- Response curve
- Central/direct/inverse spread
Live Preview: Adjust sliders and immediately hear the effect on your playing.
4. Action Rules (Button Configuration)
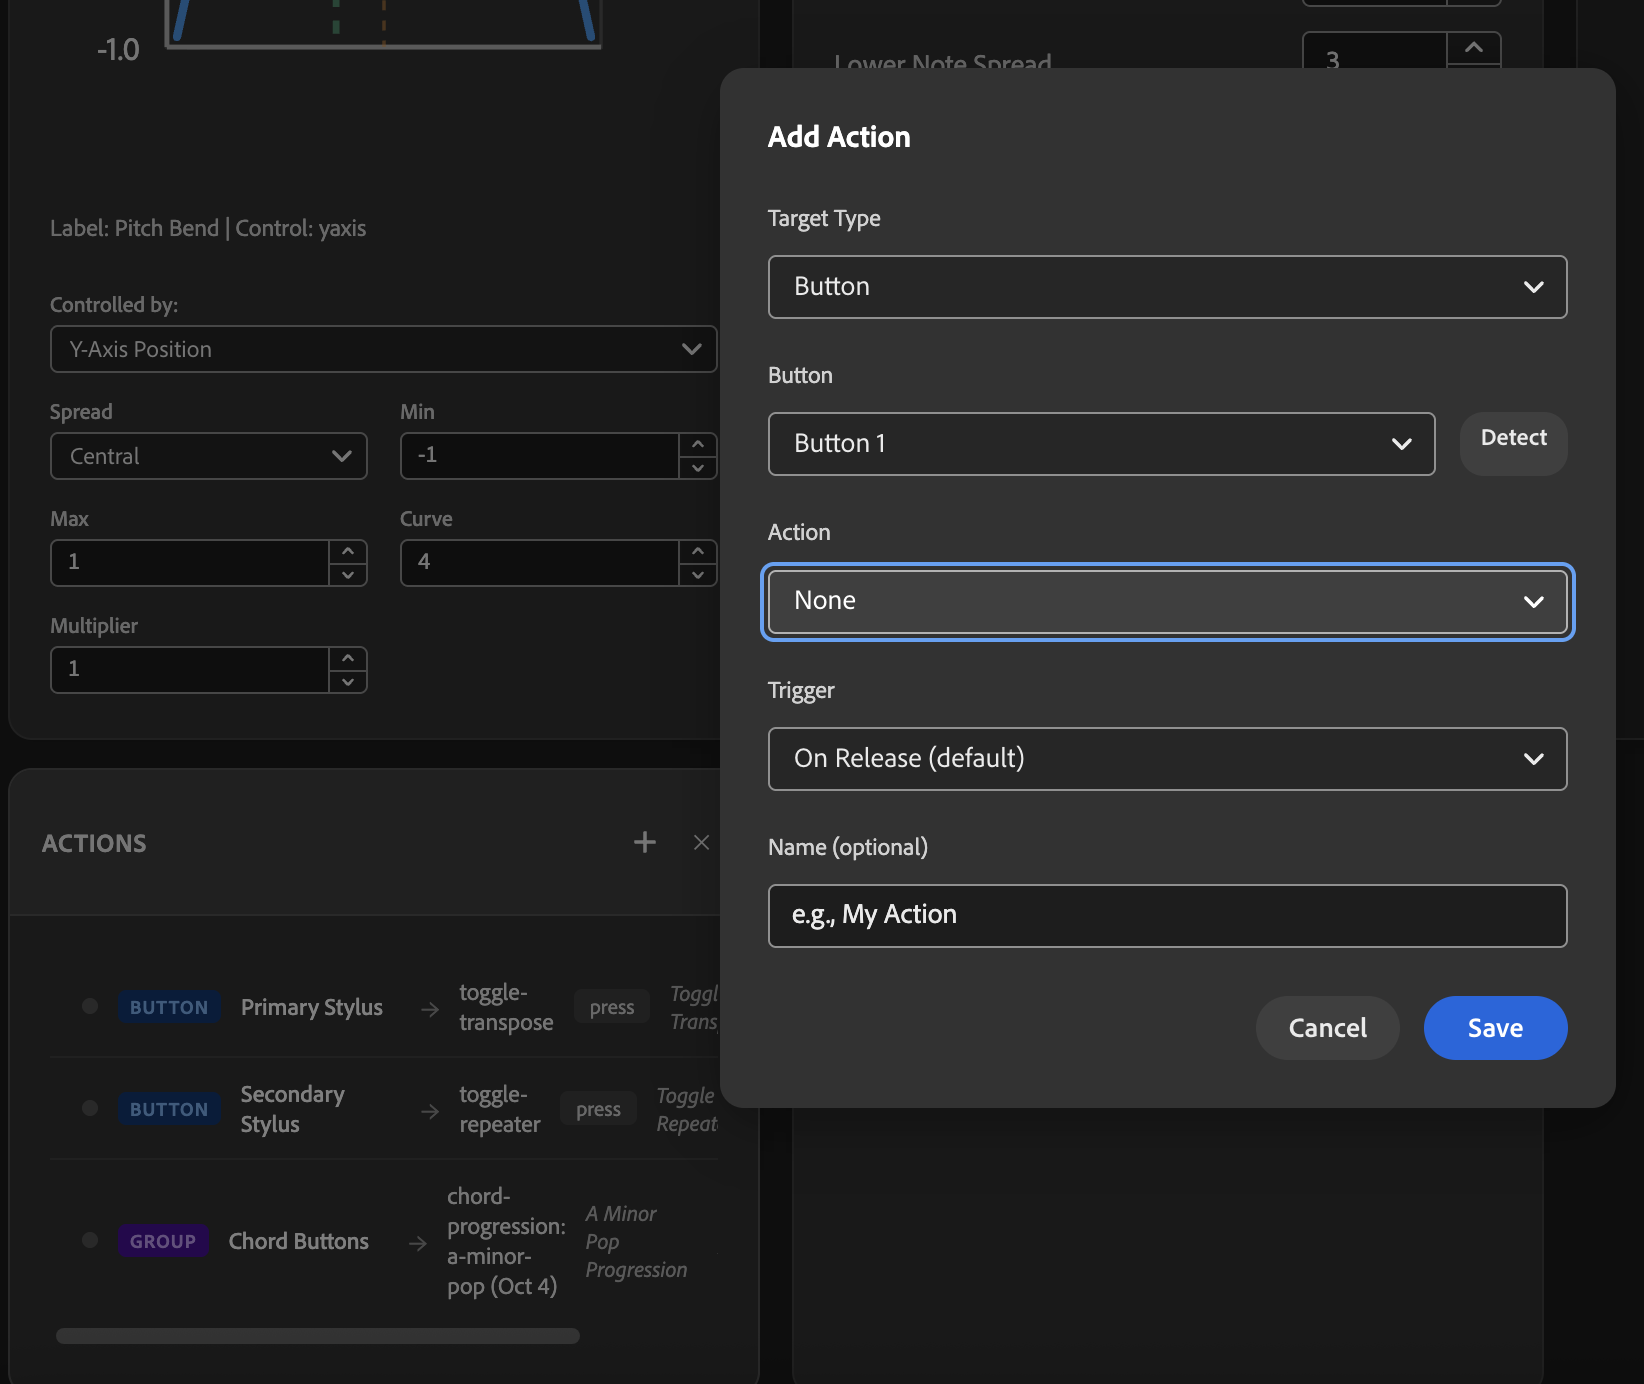
Configure stylus and tablet buttons:
- Visual Button Mapping - See which buttons are available
- Action Assignment - Drag-and-drop or select actions
- Trigger Types - Choose press, release, or hold
- Button Groups - Create chord progression groups
- Startup Rules - Set initial state
5. Strum Release
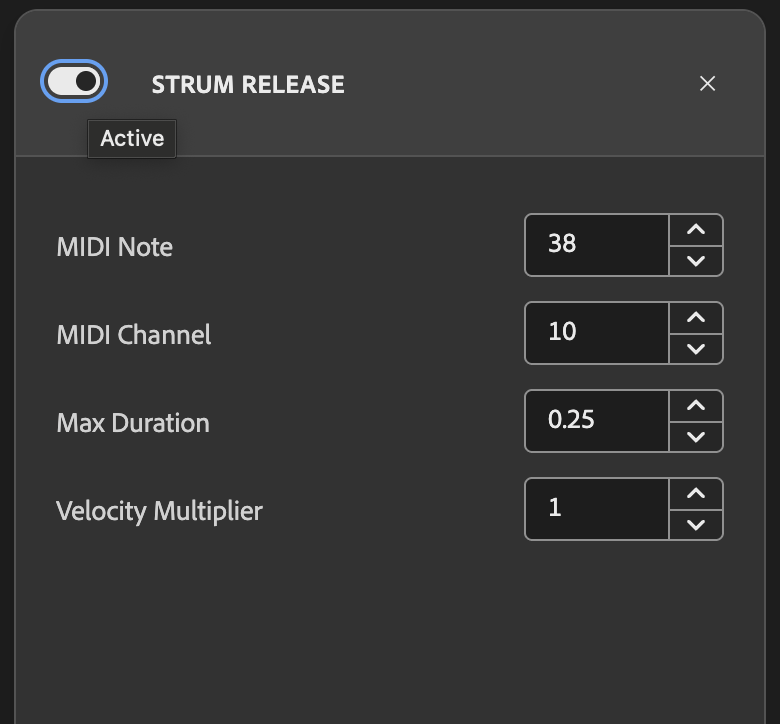
Configure drum sounds on pen lift:
- Enable/disable
- MIDI note selection
- Max duration threshold
- Velocity multiplier
6. MIDI Configuration
Note: MIDI configuration (output/input ports, backend selection) is not available in the dashboard as it requires a restart to apply. Configure MIDI settings via JSON files or command-line arguments.
MIDI Settings (Requires Restart):
- Output Port (
midi_output_id) - MIDI device to send notes to - Input Port (
midi_input_id) - MIDI keyboard for chord input - Backend (
midi_output_backend) -rtmidi(default) orjack(Linux) - Inter-Message Delay (
midiInterMessageDelay) - Prevent stuck notes on slow hardware (e.g., 0.08 for Raspberry Pi) - JACK Settings - Client name and auto-connect mode
To change MIDI settings:
-
Via JSON file - Edit
config.jsonand restart:{ "midi": { "midi_output_backend": "rtmidi", "midi_output_id": 2, "midi_input_id": null, "midiInterMessageDelay": 0.08 } } -
Via command-line arguments:
# Node.js
npm run server -- --midi-port 2

# Python
python -m sketchatone.cli.server --midi-port 2
See Configuration for complete MIDI configuration reference.
Configuration Presets
Loading Configurations
The dashboard allows you to load different JSON configuration files:
- Click "Load Configuration"
- Select a JSON file from your computer
- Configuration applies immediately
Use Cases:
- Switch between songs with different settings
- Load performance presets
- Test different configurations quickly
Saving Configurations
Save your current dashboard settings to a JSON file:
- Configure settings in the dashboard
- Click "Export Configuration"
- Save the JSON file
- Use it later or commit to version control
Creating Presets
Create multiple configuration files for different scenarios:
Example Presets:
ballad.json- Slow, expressive settings with wide pitch bendrock.json- Fast, aggressive settings with minimal bendjazz.json- Complex chords with note repeaterdrums.json- Strum release enabled for percussive hits
Switch between them instantly in the dashboard without restarting.
Live Performance Features
Real-Time Adjustments
During performance, you can adjust:
- Chord changes (via buttons or dashboard)
- Transpose on/off (via buttons)
- Note repeater on/off (via buttons)
- Parameter sensitivity (via dashboard)
Visual Feedback
The dashboard shows:
- Current chord being played
- Active transpose/repeater state
- MIDI messages being sent
- Button press events
- Tablet input values
This helps you troubleshoot issues during soundcheck or performance.
Headless Mode (No Dashboard)
For production use on Raspberry Pi or Zynthian, you can disable the dashboard entirely:
{
  "server": {
    "http_port": null,
    "ws_port": null
  }
}
This minimizes resource usage. All configuration must be done via JSON files.
Troubleshooting
Dashboard Won't Load
Check server is running:
# Look for "HTTP server listening on port 8080"Check firewall settings:
- macOS: Allow incoming connections for the app
- Linux: Ensure port 8080 is not blocked
Changes Don't Apply
Refresh the page:
- The dashboard maintains a WebSocket connection
- If disconnected, refresh to reconnect
Check console for errors:
- Open browser developer tools (F12)
- Look for WebSocket connection errors
Can't See Tablet Input
Verify tablet is connected:
- Check USB connection
- Look for device detection messages in server logs
Check device config:
- Ensure your tablet has a matching config file
- See Configuration for details
See Also
- Configuration - Complete JSON configuration reference
- Action Rules - Button configuration details
- Troubleshooting - Common issues and solutions
- Node.js CLI - Server command-line options
- Python CLI - Server command-line options